QAnon Popularity Among Generations
#Bar Plot for each generations support of QAnon
O20 %>%
group_by(cohorts) %>% filter(cohorts!="NA") %>%
ct(q38_10lab, wt=wgt) %>%
ggplot(., aes(x=reorder(cohorts, pct), y=pct, fill=q38_10lab)) +
geom_col(alpha=.8, color="black", width = .75, position = position_dodge2()) +
theme_hc() +
theme(text=element_text(family="JS", size=12),
legend.position = "right",
panel.grid.major.x = element_blank(),
panel.grid.major.y = element_line(size=.5, color="gray80"),
axis.text.x = element_text(size=9),
plot.title = element_text(hjust = .5)) +
geom_text(aes(y=(pct+.025), label = round(pct*100, digits=2)), family="JS",
position = position_dodge(width = .75)) +
scale_y_continuous(labels=percent_format(accuracy=1)) +
labs(x="", y="",
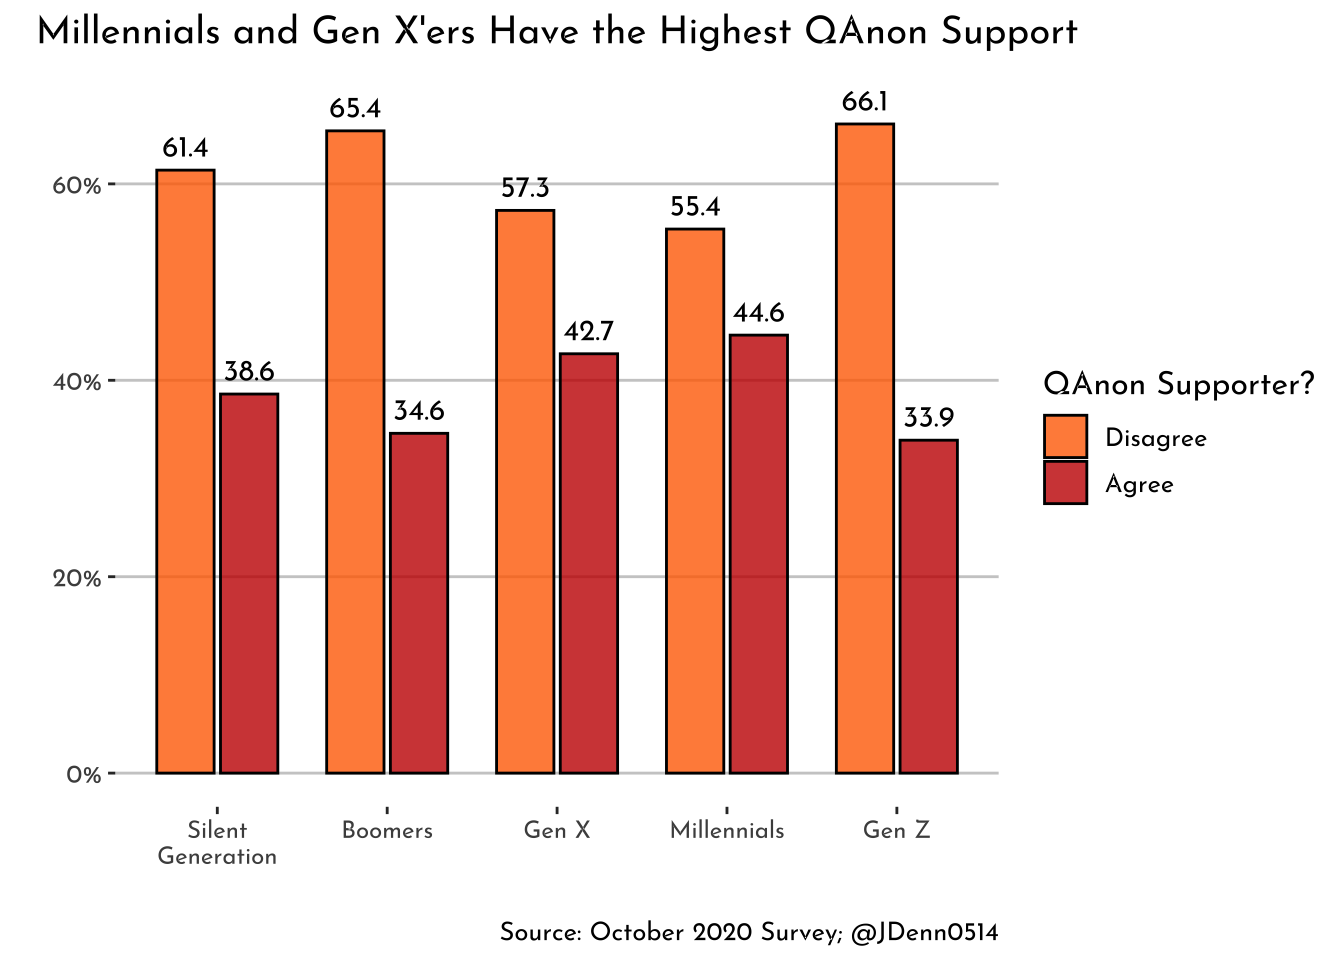
title="Millennials and Gen X'ers Have the Highest QAnon Support",
caption="Source: October 2020 Survey; @JDenn0514") +
scale_fill_manual(name="QAnon Supporter?",
labels=c("Disagree", "Agree"),
values = c("#FF6F00FF", "#C71000FF"))
Jacob Dennen
Undergraduate Researcher in the Department of Political Science
Jacob Dennen is a senior studying Political Science and conducting a year-long senior research project on antisemitism. Outside of school, he is most excited to start competing in his final season on the Men’s Tennis Team. Be sure to check out his twitter account as well.